Trend, Stoch, Price Action or in short: TSPCombining the three most important factors that a trader usually needs in a single indicator.
Red = Trend
Blue = Stoch
Orange = Price Action
[i]price

Stocks Box (by ChartArt)Get a multi-time frame (MTF) view of the price!
You can select to see either close price (default), or HL2 price, or HLC3 price, or OHLC4 price of all time-frames.And you change the smoothing method (and smoothing period) of the daily price, which is shown as a blue line, with period 10 WMA smoothing as default.
P:S. I had the drawings on the chart hidden, because they have nothing to do with the indicator, but with publishing the script they showed up again :(
[RS][JR]RSI Price BandsRSI Price Bands
By Ricardo Santos and JR
Have you ever wondered what RSI would look like as a Band? Well here it is. First premier Trading View special, RSI Price Band. Red shows overbought and Green shows oversold. You can also adjust what levels you prefer for overbought and oversold, and what additional RSI lengths you would like to see displayed on the chart..

EMA_ConvergenceFirst I have to give kudos to my son who I asked to take a shot at creating this little indicator. Nice work son!
While trading, one of the things I look for is when price or certain EMA's approach another EMA. The example that I use on this 1 minute SPY chart is an 8 EMA and 20 EMA. I am looking for when the 8 and 20 are within' 3 cents of each other. Many times when they are getting close, price is approaching a top or bottom. I am looking for a candlestick reversal around that area. You may want to know when PRICE is near the 50 EMA: Use EMA 1 and 50 for that. Having it light up on top of the page, or elsewhere, makes it easier to look for the convergence when it occurs. If it lights up for a long period, price may be going sideways. I don't enter into a trade until the EMA starts separating, usually with another candlestick formation.
You are able to change the distance for convergence and two EMA's. Unfortunately you will have to adjust the convergence number up as you increase in time frames. This is designed to see when they are close, not when they cross.
The bars on top of this example are lit up purple due to the 8 and 20 EMA are within' 3 cents of each other.
If you want to overlay the price bars, instead of having it separate, just change overlay to "true"
Enjoy.

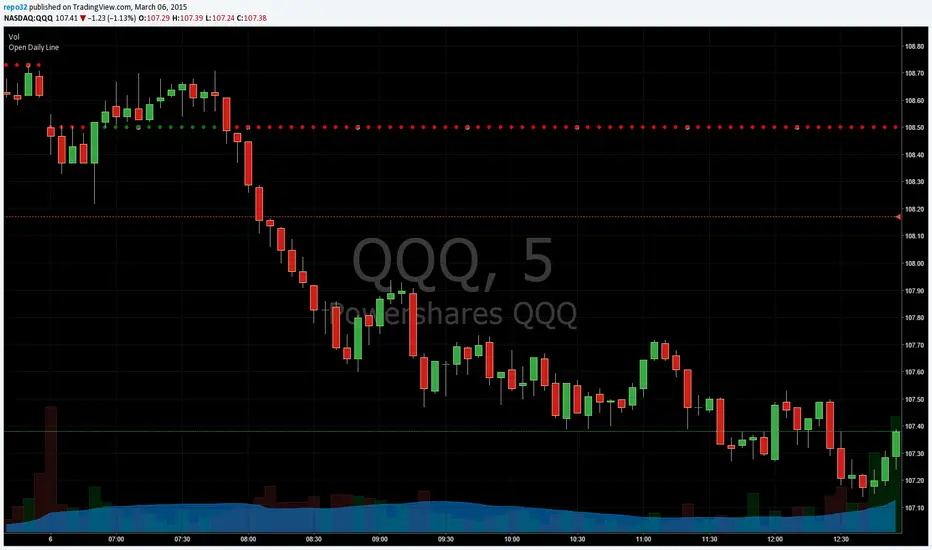
Open Daily LineThis will place circles on your chart for the opening daily price. If price is above, the circles are green. If price is below, the circles are red. I wanted to be able to see the opening price a bit easier while in smaller time frames.
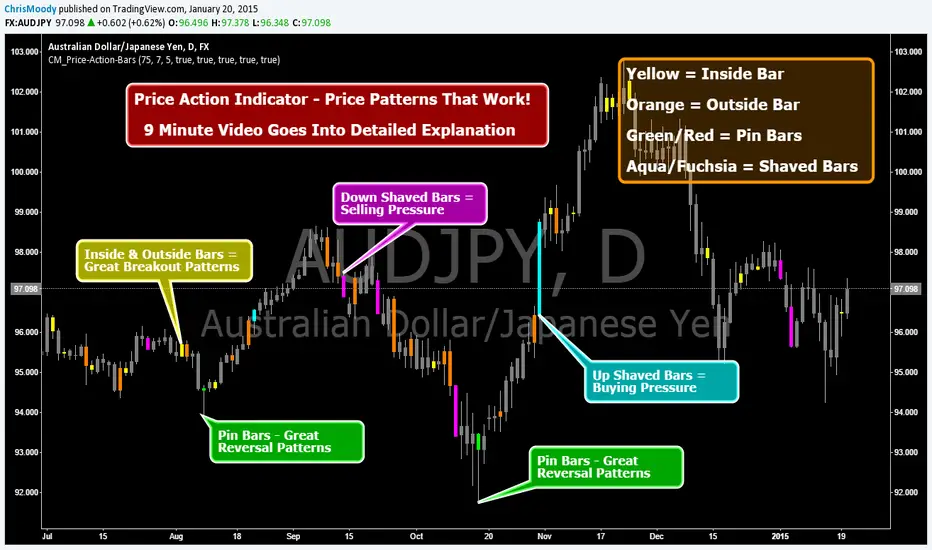
CM_Price-Action-Bars-Price Patterns That Work!Price Action Indicator - Price Patterns That Work!
9 Minute Video Goes Into Detailed Explanation
4 Simple but Effective Price Patterns!
Yellow = Inside Bar – Breakout Patterns
Orange = Outside Bar – Breakout Patterns
Green/Red = Pin Bars
Aqua/Fuchsia = Shaved Bars
***MANY Features and Customizing Options…Detailed Overview In Video.
How To Turn Bars Patterns On And Off.
Ways To Customize.
General Thought Process of the 4 Price Action Patterns.
What Each Setting in the Inputs Tab Does.
***Special Announcement. Video Below Just Updated. Received a Special Promotion from the creator of these Price Action Bars and Many other Price Action Setups. Hedge Fund Manager and Founder of 2ndSkiesForex.com Chris Capre.
1st 10 minutes of Video is covering throughout process and how to implement the Indicators.
2nd 12 minutes covers a Special Promotion offered to TradingView members directly from Chris Capre.
Video Link Below.
vimeopro.com
This Version of the video will be taken down 2/01/2015 and the original video will be uploaded again.
[Bitcoin] Spot price vs Futures indicatorA handy script to detect opportunities in the futures market during extreme movement.
During rallies, futures usually tend to be US$10 above spot price, on the other hand it can be $1 below spot price when the price starts to decline.
You could also draw a trendline to it :) measuring the amount of risk people are willing to take just to predict future prices in the rally/decline.
Credits to lowstrife for the idea, I'm just implementing it :)

[RS]Cumulative Average Price Gridgrid based on the cumulative average price.
on a sidenote: looks like im baned from chat for a week.

[RS]Cumulative Average PriceCumulative average price
edit: forgot about hidden tools, study is black average price line

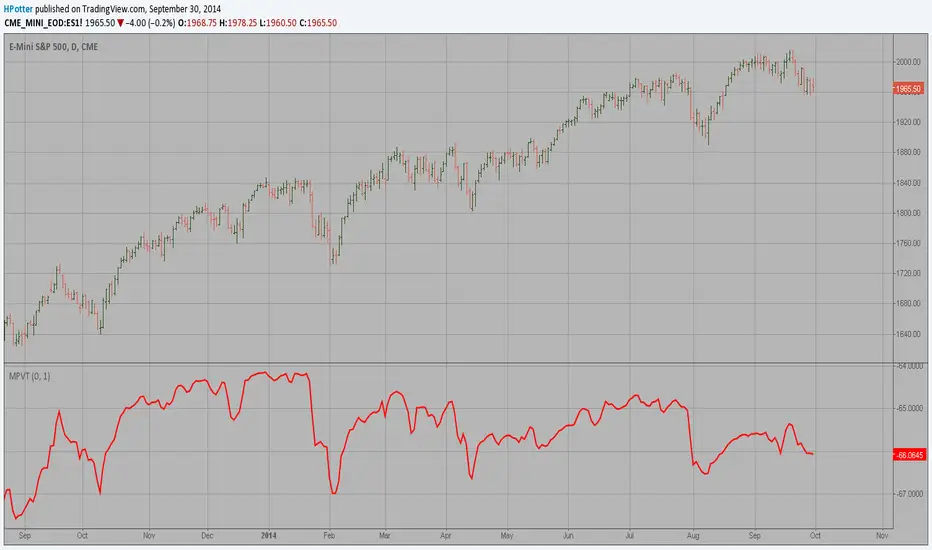
Modified Price-Volume Trend Indicator The related article is copyrighted material from Stocks & Commodities Apr 2010.
Short-term Volume And Price Oscillator [LazyBear]Short-term Volume and Price Oscillator (SVAPO), developed by Sylvian Vervroot, combines both Price and Volume to construct an oscillator. In essence, when the price is trending up and volume is increasing, volume is added into the oscillator calculation. Conversely, when price is trending down and volume is increasing, volume will be subtracted from the oscillator. During consolidation phases when price and volume diverge, volume is not used to calculate the oscillator.
Some notes from his book:
- A buy is indicated when the oscillator is below the green line but greater than yesterday’s value.
A sell is indicated when the oscillator is above the red line but less than yesterday’s value.
- The start of a short term up move is signaled by SVAPO when it turns up from below the lower standard
deviation boundary. The same is valid for a short term down move when SVAPO turns down from above the
upper standard deviation boundary.
- Medium term turning points in an up or downtrend are mostly announced with a divergence between price and
SVAPO. In a medium term uptrend, SVAPO will generally continue to move above the 0-reference line.
More info:
stocata.org
stocata.org
Vervroot sometimes uses this with his modified %B oscillator ().
List of my other indicators:
- Chart:
- GDoc: docs.google.com

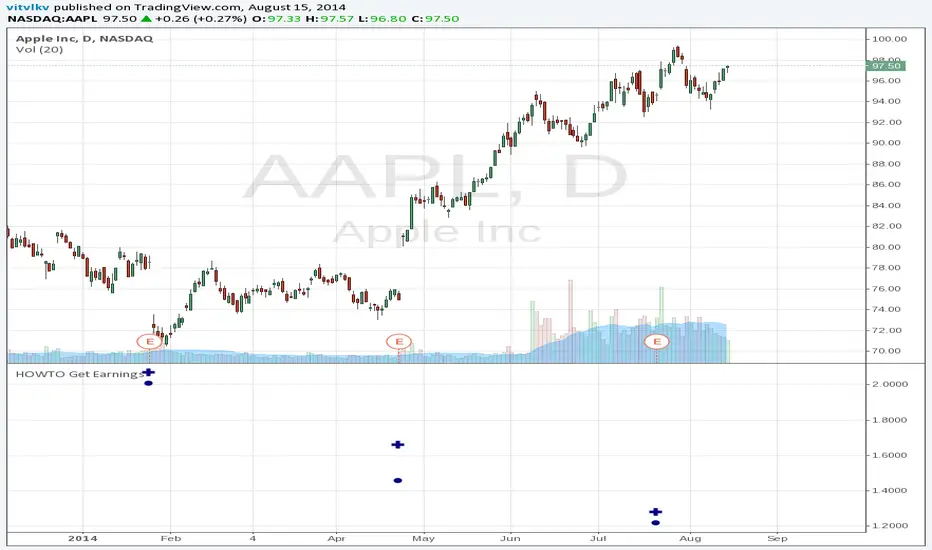
Earnings S/R Levels [LazyBear]These levels are based on price around earnings day. I have implemented support for 2 calculation modes:
Mode 1: Level = (low of 1 day prior to earnings + high of 1 day after earnings) / 2.0
Mode 2: Level = (hl2 of 1 day prior to earnings + hl2 of 1 day after earnings + close from earnings day) / 3.0
Chart above shows "Mode 1". Mode can be changed via options page.
This indicator was requested by user @mika2k1ff. I learnt more about this idea from @DanV and @TimWest (Thanks guys :)). BTW, TimWest has an indicators package, "Key Hidden Levels", that has this and more.
Do let me know how you use this, I am very intrigued by the potential this idea shows. Thanks.
For a complete list of my indicators:
- GDoc: docs.google.com
- Chart:

Indicator: Volume Price Confirmation Indicator (VPCI)Developed by Buff Dormeier, VPCI won 2007 Charles H Dow award by the MTA. VPCI plots the relationship between price trend and the volume, as either being in a state of confirmation or contradiction.
Excerpt from article below:
"Fundamentally, the VPCI reveals the proportional imbalances between price trends and volume-adjusted price
trends. An uptrend with increasing volume is a market characterized by greed supported by the fuel needed to
grow. An uptrend without volume is complacent and reveals greed deprived of the fuel needed to sustain itself.
Investors without the influx of other investors (volume) will eventually lose interest and the uptrend should
eventually breakdown.
A falling price trend reveals a market driven by fear. A falling price trend without volume reveals apathy, fear
without increasing energy. Unlike greed, fear is self-sustaining, and may endure for long time periods without
increasing fuel or energy. Adding energy to fear can be likened to adding fuel to a fire and is generally bearish
until the VPCI reverses. In such cases, weak-minded investor's, overcome by fear, are becoming irrationally
fearful until the selling climax reaches a state of maximum homogeneity. At this point, ownership held by weak
investor’s has been purged, producing a type of heat death capitulation. These occurrences may be visualized by
the VPCI falling below the lower standard deviation of a Bollinger Band of the VPCI, and then rising above the
lower band, and forming a 'V' bottom. "
Full article: www.mta.org
Nearly all parameters are configurable and exposed via "Options" page (enable/disable BB, enable/disable breach-markings, enable/disable MA, ...).Also check the source for enabling "histogram" (difference between VPCI and MA of VPCI).
Do note that the shortTerm/longTerm lengths need tuning for your instrument. The default 5/20 is not optimal, in my quick check.
